We sometimes forget about some of the most important Google Analytics reports – and they can be extremely valuable.
Google Analytics reports come in all shapes and sizes. We can generate some broad, basic reports that provide us with insights into the activity that takes place on our site, but there also exists a world of highly targeted Google Analytics reports and extremely valuable features that can be quite useful when it comes to crafting strategies both on and off our website.
These five Google Analytics reports and features often go overlooked by the 95% of tracked websites that use Google’s site tracking software.
Secondary Dimensions
Often times we populate reports in our Google Analytics Dashboard and completely neglect the secondary dimensions capabilities that allow for an even deeper understanding of our audiences and the effectiveness of our content.

Screenshot taken 6/6/2014
By leveraging the insights provided by secondary dimensions, we can begin to compare actions, audiences and content, which will help us optimize certain content sharing strategies outside of our websites. We can also begin to develop a streamlined approach to our Google Analytics Dashboard, connecting as many reports as possible to one another in an effort to simplify the robust platform.
Trackbacks
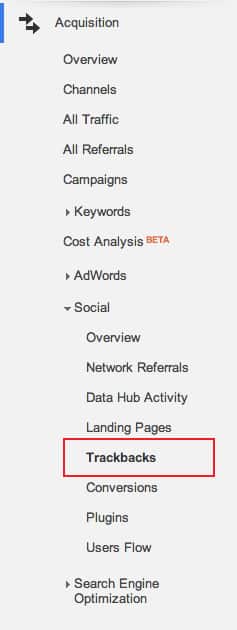
Generally, most social media marketers will be familiar with the value of monitoring Trackbacks in Google Analytics, but the average user might not even be familiar with what a Trackback report is, and why it can be so useful to, once again, building a more effective content marketing strategy both on and off of our websites.
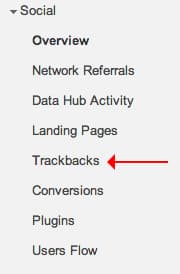
Screenshot taken 6/6/2014
So what exactly are Trackbacks? Any time that an external resource links to a piece of content on your website (a ping, pingback, or, as many of us understand it, a backlink) it may register as a Trackback. The difference here is that these reports also include referrals from different social media. So in monitoring your Trackbacks and, more importantly, who posted the link, you can see potential prospects, leads or perhaps even the oft-sought after brand advocate sharing your content on the social web.
Users Flow
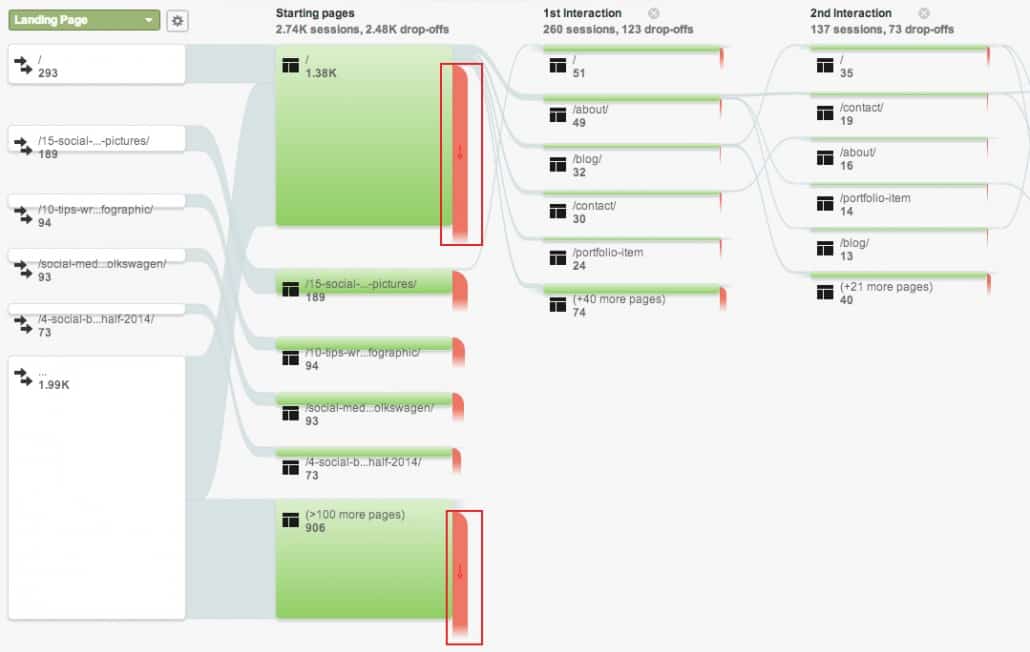
The Users Flow report can be found in a number of different places within Google Analytics. It is housed under the Audience, Social and Behavior report sections, and each one is equally valuable.
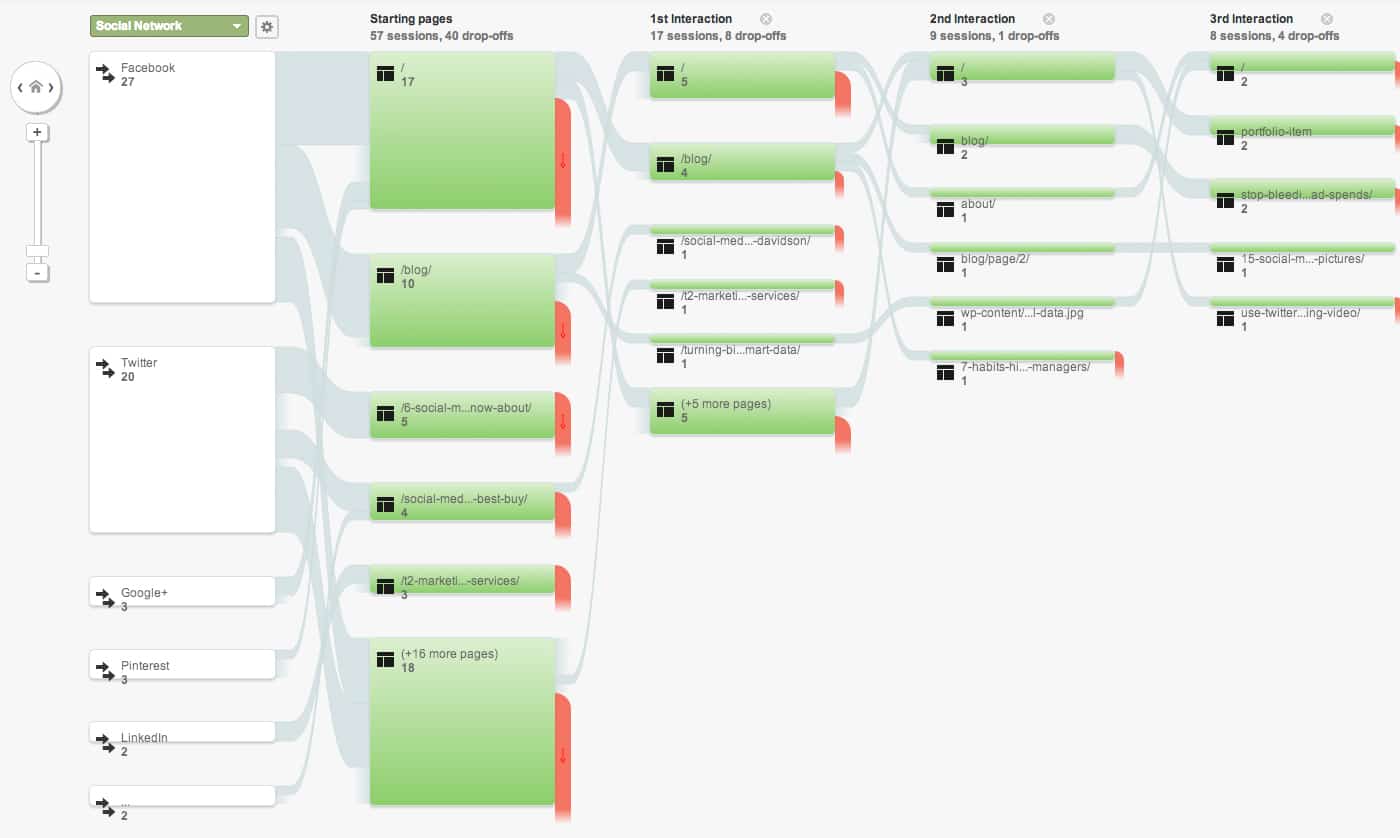
Screenshot taken 6/6/2014
The Users Flow chart showcases exactly where users originate, where they land on a website, what pages are visited during a particular session and what activities, or perhaps actions were taken during said visit. Essentially, your Users Flow report can tell you quite a bit about how well your content resonates and what content leads to second or even third impressions within your website. This helps you further optimize the content strategy you have built for your brand online.
Goals and Filters
Goals and filters do not necessarily have to have an e-commerce focus. Goals can be created for a number of different reasons, ranging from economic conversions to a certain number of pages visited per session. Yet so many users tend to overlook the goals feature if they do not plan on selling any product on their websites – and that’s a true opportunity missed.
The same holds true for filters. Creating filters can provide some additional insights into the actions taken by users originating from a specific source. Say, for example you want to know more about the audience referred from LinkedIn. By creating filters specific for the LinkedIn URL, you can see only the activity and engagement of visitors that arrived from this source.
Now how can goals and filters be used together?
Imagine yourself an investor in social advertising for your brand, and you want to optimize your target audience based on the likelihood that they will convert. This research process is accomplished much more easily with the help of goals and filters, as you can now filter for each social network, set goals for a specific type of conversion (maybe a newsletter signup) and see where your ad dollars will be best spent.
On a side note, you can also assign monetary values to abstract goals, like a newsletter signup, based on the value you perceive each conversion possessing.
Cost Analysis
For AdWords users and advertisers, a lot of time is spent looking at AdWords reports, but not enough time is given to Google Analytics reports focusing on AdWords campaigns.
The Cost Analysis report in Google Analytics provides some great insight into where dollars were spent, what events took place and helps advertisers compare channels, keywords and campaigns in order to optimize programs (both in real time and on an ongoing basis). The reports produced allow users to see costs of individual campaigns compared to revenue (which can be tacked on using the conversion tool in AdWords or goals in Google Analytics) in order to understand the performance of campaigns and avoid making any costly mistakes the second or third time around.
Google products are intended to be used with one another, and this is a perfect example of how AdWords and Analytics can help advertisers work more efficiently (and more economically).
Conclusion
Google Analytics reports are varied and a lot of them are extremely useful. Though 95% of websites that track their data do so with Google Analytics, so few are really using the tool to the best of its abilities. It can be so much more than a means to monitor site traffic!
Start using some of these reports and watch as the effectiveness of your online strategies very quickly begins to increase. It won’t be long before you see your website performing just as effectively as social networks when it comes to building relationships and generating new business!





 Google Analytics is an outstanding tool. With the right filters, goals, segments and understanding, it can be as powerful as many enterprise level softwares when it comes to tracking the success of your digital and social marketing.

